
 Since the Reporting Tool feature was the most requested on the feedback page, we have included it in the new RSTickets!Pro, so you can measure the quality of your Joomla! support department in a professional way .
These reports can show you how active and efficient are your staff members and how engaged and satisfied are your customers.
Since the Reporting Tool feature was the most requested on the feedback page, we have included it in the new RSTickets!Pro, so you can measure the quality of your Joomla! support department in a professional way .
These reports can show you how active and efficient are your staff members and how engaged and satisfied are your customers.
Reports and filters
The Reporting Tool includes 6 reports and 5 filters, to refine the results and generate reports with different levels of complexity. The charts will reveal the evolution of the support department. Below the chart, RSTickets!Pro calculates the minimum, maximum, average and the total of items for the chosen time unit.
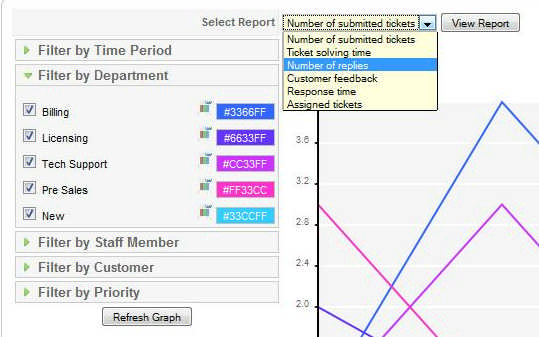
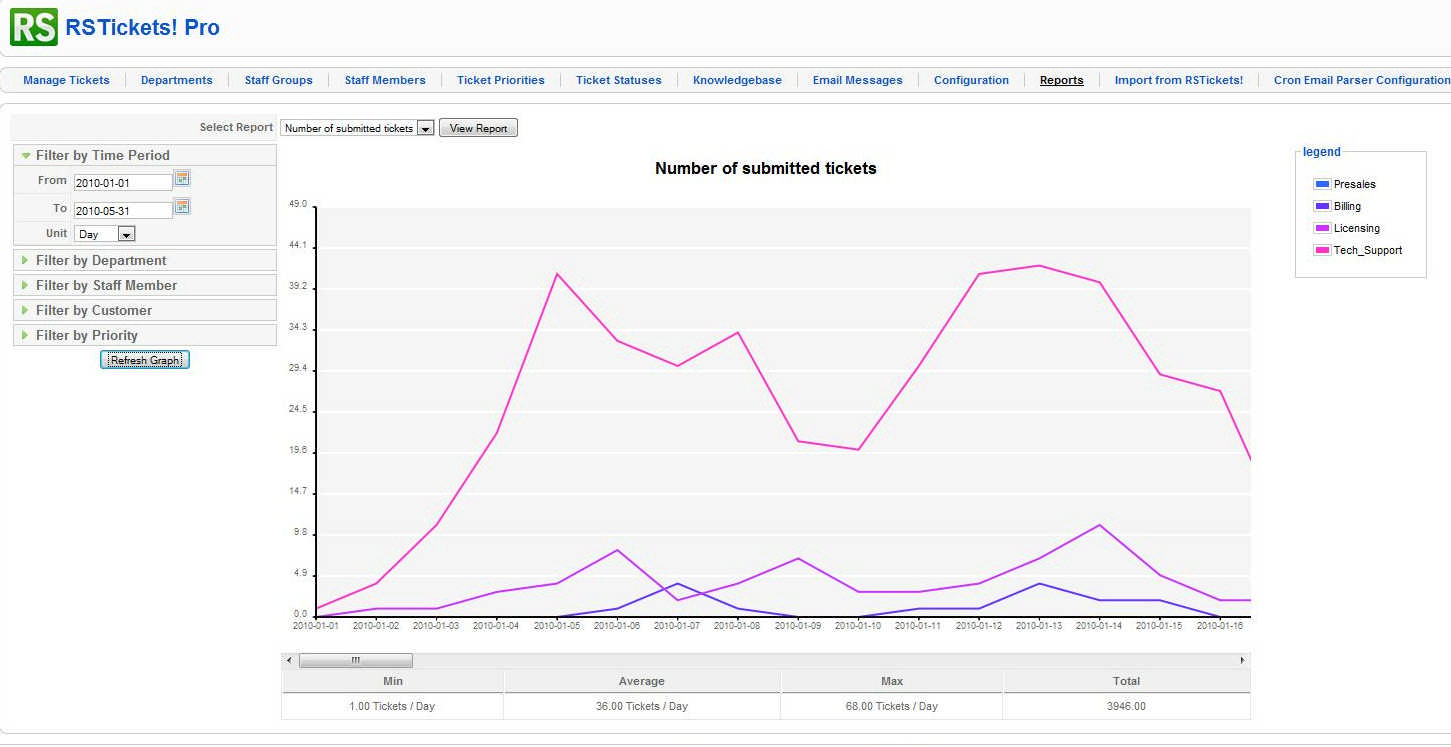
1. Number of submitted tickets
This report will show you valuable data about the number of the submitted tickets for a specific time period, staff member, department, customer or priority.
Besides the generated chart, RSTickets!Pro will calculate the minimum, maximum, average and the total number of the submitted tickets.
Other examples of reports that you can generate:
- how many tickets had the Presales Department last month?
- how many tickets had the staff member Steve Matt, on 03/04/2010 ?
- or even better, how many tickets had the customer X last year?
(the list can continue when applying different filters)
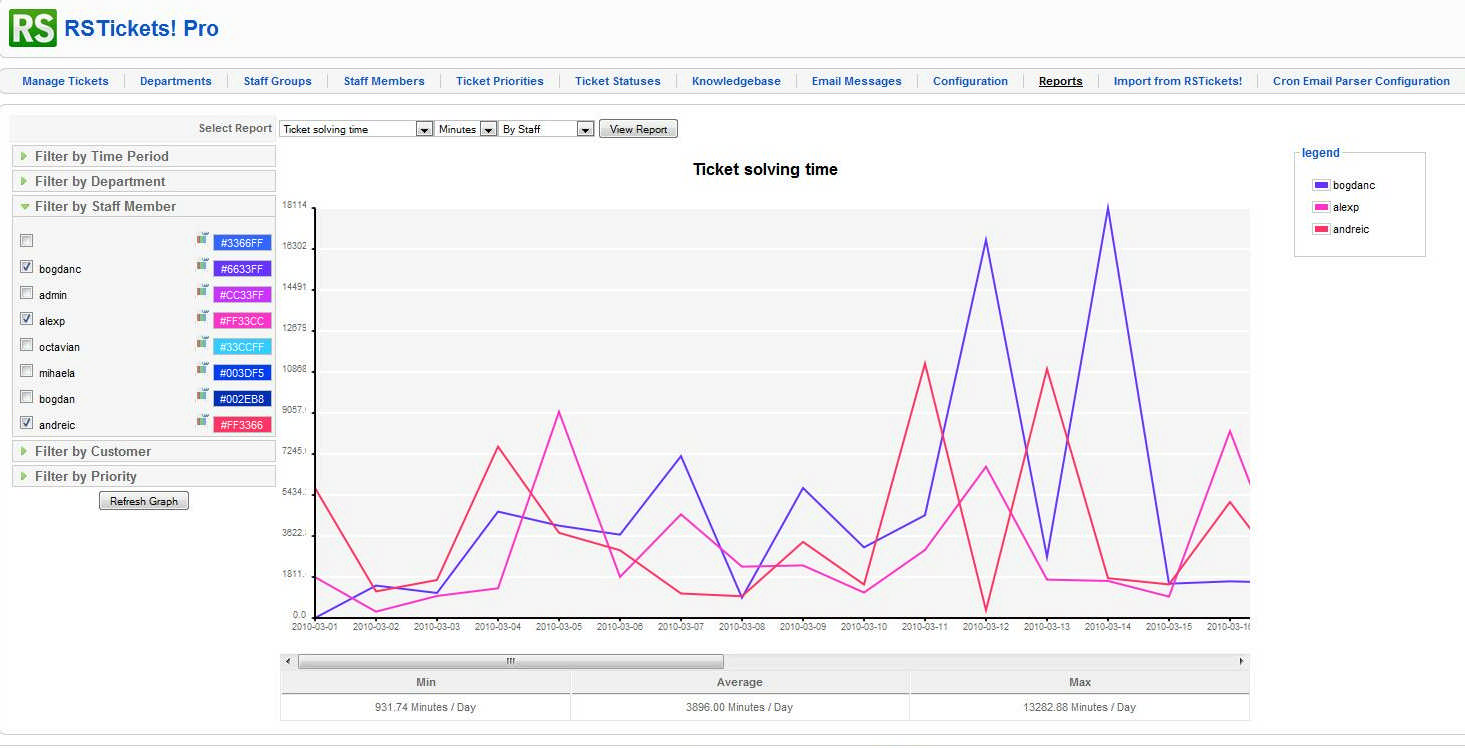
2. Ticket solving time
In RSTickets!Pro, the ticket solving time is calculated, from the moment of the first reply until closing time, to help you determine the time needed by the support department to solve customers' issues.
e.g. Between 03/01/2010-03/21/2010, the average ticket solving time is 3896.00 Minutes/ Day , with a minimum ticket solving time of 931.74 Minutes / Day and a maximum of 13282.88 Minutes / Day.
Use this report if you want to find out:
- the time needed by the pre-sales department to solve tickets?
- the average ticket solving time for the Tech Support Department
- what is the average ticket solving time for the customer X?
(the list can continue when applying different filters)
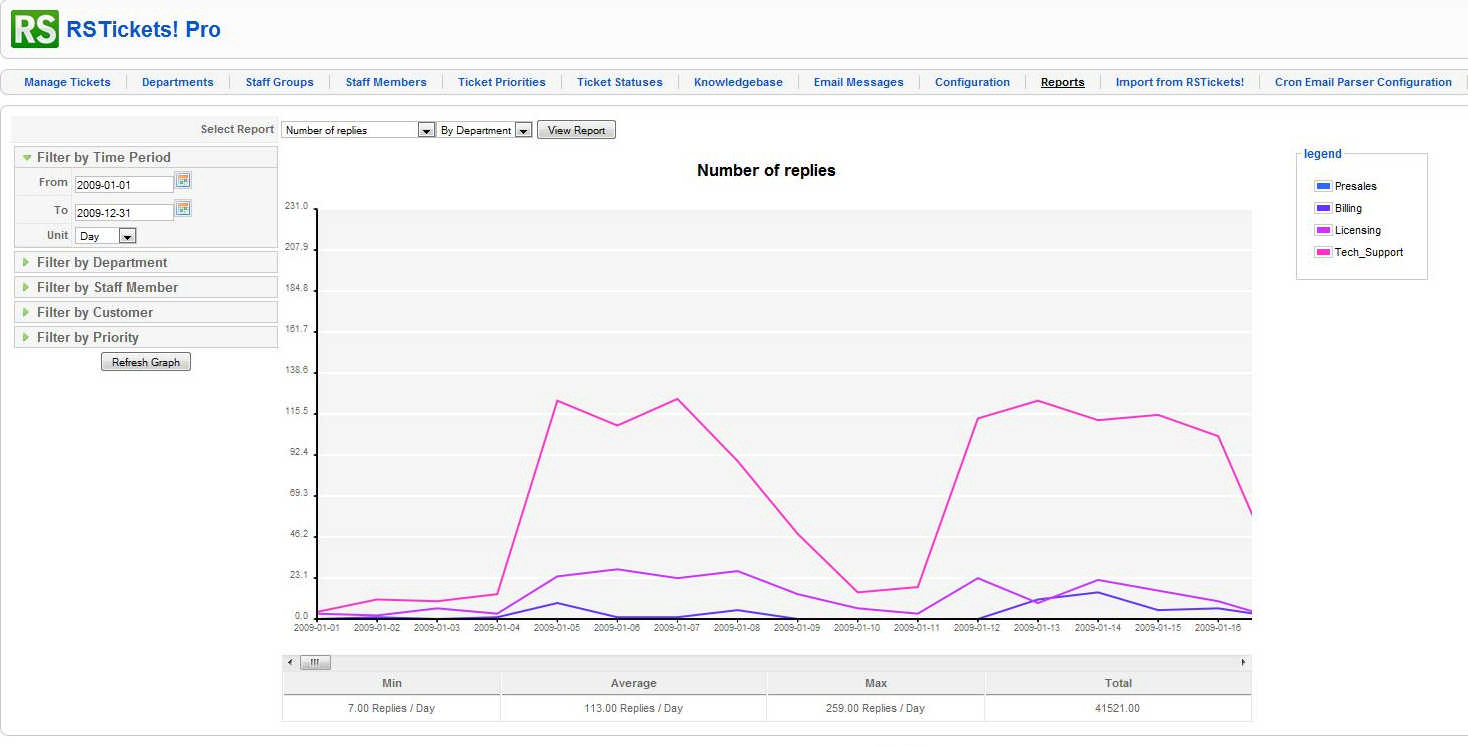
3. Number of replies
This report will show you the number of ticket replies, from the moment when a ticket has been opened until closing time.
Below the chart, you will find some statistical data: minimum, maximum, average and the total number of replies for all tickets.
You will be able to see these metrics reported to a specific department, staff member or ticket priority.
e.g. The average number of replies in 2009 for all tickets was 113, with a minimum of 7 ticket replies/day, maximum 259 and the total of 41521 for the entire month. All filters are active.
Use this report if you want to find out:
- what is the number of the ticket replies for the Tech Support Department?
- how many times did the staff member Andrew Scott replied to tickets?
- or even better, what is the day when the customer Y had a maximum of replies to tickets last month?
(these are only a few examples of reports generated with this tool )
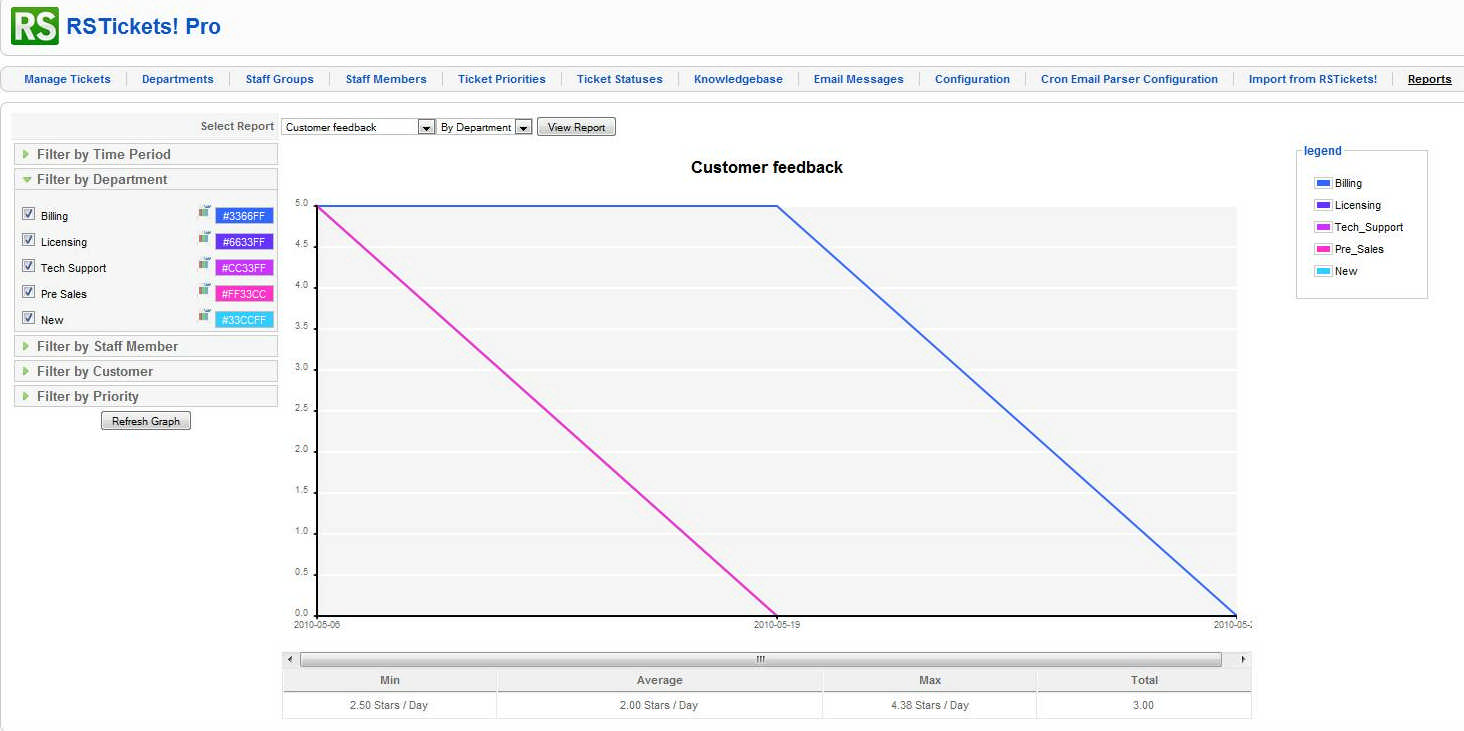
4. Customer feedback
RSTickets!Pro allows your users/customers to rate the staff's tickets on a scale from 1 to 5.
Besides the generated chart, this report will calculate the average rating, minimum, maximum and the total of stars for the chosen time period.
e.g. The data between 05/01/2010 - 05/31/2010 shows that the average stars for tickets was 2 stars/day with a minimum rate of 2.5 stars/day, a maximum of 4.38 stars/day and a Total of 3 stars for the entire month.
For this example all filters are selected.
More specific reports:
- what is the average rating given by customers for the staff member Steve Matt?
- what is the average rating received by the Presales Department last year?
(the list can continue when applying different filters)
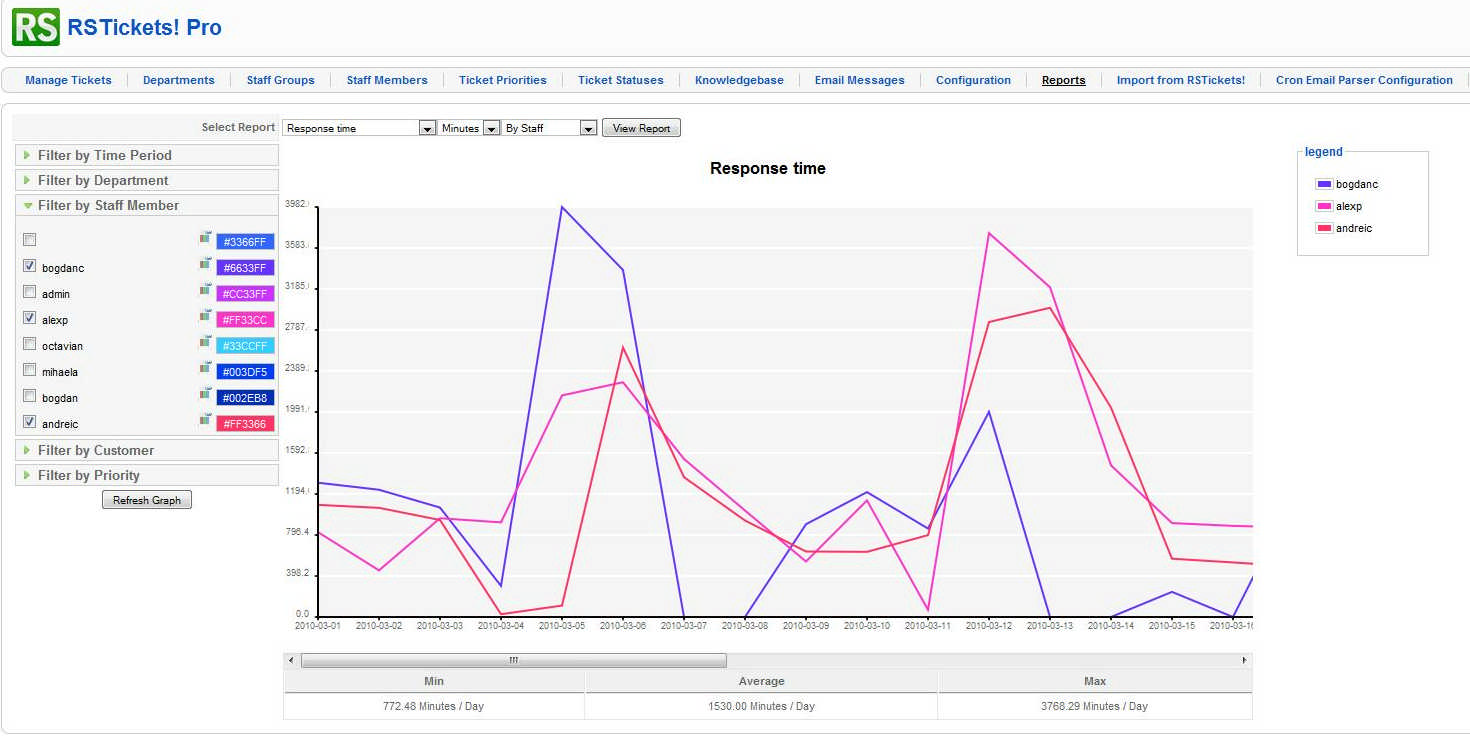
5. Response time
RSTickets!Pro also, calculates some analytics data for the response time report: minimum, maximum, the average and the total response time expressed in minutes, hours or days.
e.g. The staff response time between 05/01/2010-05/31/2010 is 1530.00 average Minutes / Day, with a minimum of 772.48 minutes/day and a maximum of 3768.29 Minutes / Day.
Examples of reports that you can generate:
- the maximum response time of high priority tickets
- how responsive is the tech department
- compare the response time of each staff member
(and so on...)
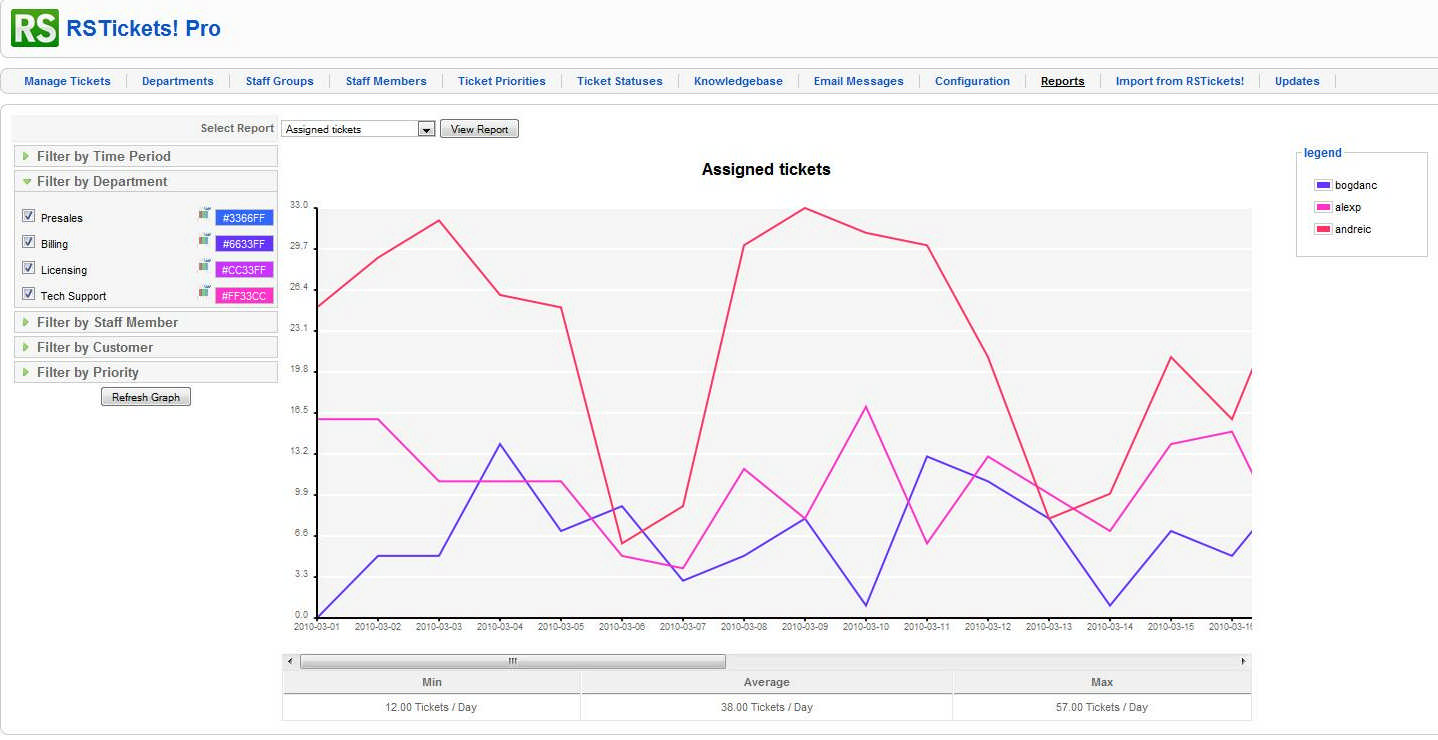
6. Assigned tickets
This report gathers data about the number of assigned tickets to be able to compare the staff members activity: which one had a maximum/minimum of assigned tickets and what is the average number for a specific time period.
e.g.: In March, 2010, the staff had an average of assigned tickets equal to 38 tickets/day, with a minimum of 12 tickets/day and a maximum of 57 tickets/day.
Use this report if you want to find out:
- how many assigned tickets with high priority had the support department last month ?
- how many tickets have been assigned to the staff member X, in the department Tech Support?
- what is the maximum number of assigned tickets for a certain customer?
(and so on...)
In this post we've described several ways to evaluate the support department activity using the RSTickets!Pro Reporting Tool.
What methods do you use to measure your staff efficiency?
How do you use the Reporting Tool?